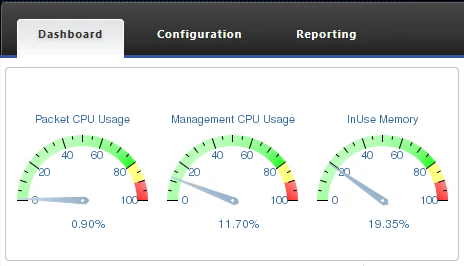
When our Netscaler InUse memory usage showed 85%+, the StoreFront and Delivery Controllers load balancers stopped working, and the Netscaler Gateway web pages intermittently stop displaying and timed out while users were trying login remotely.
Normal/Low Usage-
We started noticing our Primary Netscaler was slowly using more and more memory over the course of a of a week. Eventually when we started receiving reports of connection failures and users having issues accessing the Gateway web page I noticed the Netscaler was using around 85 percent of its total memory.
To quickly resolve the issue for our users we failed over to the secondary Netscaler node. Next step was to find out why this occurred.
We quickly gathered the support files from the Netscaler, created a Citrix support case and uploaded the files to TaaS.Citrix.com for analysis.
After a couple weeks it was determined that there was bug in the Netscaler firmware and we would need to upgrade our firmware to 11 63.16 or disable AppFlow and HDX Insight.


